Synthesis and structures
The synthetic routes for the ligands and their corresponding Ce(III) complexes are illustrated in Scheme S1. Pyrazole derivatives were purchased and used without further purification. KBp4Me was obtained by heating 4-methylpyrazole and potassium borohydride (KBH4) until 2 equiv. of H2 had been evolved. KTp4R (R = Me, Cl) were prepared by heating the corresponding pyrazole derivative and KBH4 until 3 equiv. of H2 had been evolved. KTp4I was synthesized by refluxing 4-iodopyrazole (HPz4I) with KBH4 in xylene for 48 h. Ce(Tp4Me)(Bp4Me)2 was synthesized in a N2 glovebox by directly mixing KTp4Me (1 equiv.), KBp4Me (2 equiv.) and cerium triflate (Ce(OTf)3) (1 equiv.) in tetrahydrofuran (THF) and stirring overnight, followed by purification via thermal gradient sublimation under vacuum. The synthesis and purification of Ce(Tp4Me)2(Bp4Me) is similar to Ce(Tp4Me)(Bp4Me)2, but instead of a 2:1:1 molar ratio of KTp4Me, KBp4Me, and Ce(OTf)3 were used. Ce(Tp4R)3 (R = Me, Cl, I) were prepared in a N2 glovebox by adding the methanol solution of KTp4R (3 equiv.) to the methanol solution of Ce(OTf)3 (1 equiv.) and stirring overnight. Ce(Tp4Me)3 and Ce(Tp4Cl)3 were purified by thermal gradient sublimation, while Ce(Tp4I)3 was purified by recrystallization from n-hexane/THF. The detailed experimental procedures for the synthesis of the ligands and corresponding Ce(III) complexes are provided in the Materials and Methods.
Single crystals of the five Ce(III) complexes were obtained by slow evaporation from a mixed solution of THF and n-hexane (Ce(Tp4Me)(Bp4Me)2 and Ce(Tp4R)3 (R = Me, Cl, I)) or thermal gradient sublimation (Ce(Tp4Me)2(Bp4Me)), and single-crystal X-ray diffraction (SXRD) was performed to investigate the coordinate geometry of these Ce(III) complexes. The crystal structures are presented in Fig. 2, and detailed crystal data are summarized in Tables S1 and S2. The bond lengths between Ce(III) and coordination N atoms are listed in Table 1. From Ce(Tp4Me)(Bp4Me)2 to Ce(Tp4Me)2(Bp4Me), then to Ce(Tp4R)3 (R= Me, Cl, I), the coordination number increases progressively from 7 to 8, then to 9, and the average bond length of Ce-N increases from 2.585 Å to 2.612 Å, then to ~2.67 Å. To evaluate the protection of the Ce(III) center afforded by the coordinating ligands, percent buried volume (%Vbur) values of the Ce(III) complexes, which is defined as the fraction of the ligand volume relative to the total volume of a sphere centered on the metal, were calculated from their single-crystal structures. As shown in Figure. S1, with increasing coordination numbers, %Vbur values of these Ce(III) complexes also increase gradually from 89.3% to 92.0%, then to ~94%. Since the coordination between the Ce(III) center and the ligands involves weak electrostatic interactions, higher coordination numbers and more crowded coordination environments may lead to varied coordination geometries and diverse photophysical properties.

a Ce(Tp4Me)(Bp4Me)2, (b) Ce(Tp4Me)2(Bp4Me), (c) Ce(Tp4Me)3, (d) Ce(Tp4Cl)3, (e) Ce(Tp4I)3. Coordination polyhedrons of the five Ce(III) complexes: Ce(Tp4Me)(Bp4Me)2, Ce(Tp4Me)2(Bp4Me), Ce(Tp4Me)3, Ce(Tp4Cl)3 and Ce(Tp4I)3 (Left to right). Ce atoms are represented in light-yellow, B in pink, N in blue, C in grey, Cl in green, and I in purple. H atoms are omitted for clarity
Photophysical properties
The UV-vis absorption spectra of only Ce(Tp4Me)(Bp4Me)2, Ce(Tp4Me)2(Bp4Me) and Ce(Tp4Me)3 were measured in dichloromethane (DCM), since Ce(Tp4R)3 (R=Cl, I) are almost insoluble in DCM. Besides the absorption peaks below 260 nm that are mainly attributed to the ligand (Fig. 3a–c and Fig. S2, S3), the UV-vis spectra of Ce(Tp4Me)(Bp4Me)2, Ce(Tp4Me)2(Bp4Me) and Ce(Tp4Me)3 display absorption bands ranging from 260 nm to 400 nm with maximum molar extinction coefficients (εmax) of 716 L mol−1 cm−1, 746 L mol−1 cm−1 and 538 L mol−1 cm−1, respectively. These absorption bands are attributed to the parity-allowed 4f-5d transition of Ce(III), which is consistent with the time-dependent density functional theory (TD-DFT) results. According the natural transition orbitals (NTO) analysis (Fig. 3d–f), the lowest-energy absorption peaks occur at 361 nm, 373 nm and 343 nm for Ce(Tp4Me)(Bp4Me)2, Ce(Tp4Me)2(Bp4Me) and Ce(Tp4Me)3, respectively, corresponding to 4fxyz to 5dxz/5dyz transition in the first two complexes and 4fxyz to 5dz2 transition in the latter complex.

TD-DFT calculated (black dotted line) and experimental (blue solid line) absorption of (a) Ce(Tp4Me)(Bp4Me)2, (b) Ce(Tp4Me)2(Bp4Me), (c) Ce(Tp4Me)3. The predicted spectra were rendered as Gaussian line shapes. Oscillator strengths for the electronic transitions are shown as black vertical lines. Calculated NTOs of the lowest energy transition for (d) Ce(Tp4Me)(Bp4Me)2, (e) Ce(Tp4Me)2(Bp4Me), (f) Ce(Tp4Me)3 in the gas phase with an iso-surface value of ±0.05
The photoluminescence properties of Ce(Tp4Me)(Bp4Me)2, Ce(Tp4Me)2(Bp4Me) and Ce(Tp4Me)3 in DCM were measured both at room temperature (RT) and 77 K. At RT, the three complexes exhibit bright blue emissions under excitation wavelengths from 300 nm to 380 nm, with maximum emission peaks (λmax) located at 444 nm, 445 nm and 445 nm, respectively (Figs. 4a–c and Fig. S4). The full widths at half maxima (FWHMs) are 86 nm, 84 nm, and 83 nm for Ce(Tp4Me)(Bp4Me)2, Ce(Tp4Me)2(Bp4Me), and Ce(Tp4Me)3, respectively. To further elucidate the essence of the d-f transition, the PL spectra were analyzed by using Gaussian peak fitting. As shown in Fig. S5, each emission spectrum can be fitted into double peaks with an energy difference of about 2000 cm−1, corresponding to the transition from the 5d excited state to the two 4f ground states (2F5/2 and 2F7/2) in Ce(III) centers. As shown in Fig. S6, the excited-state lifetimes (τ) are 54 ns, 57 ns and 57 ns for Ce(Tp4Me)(Bp4Me)2, Ce(Tp4Me)2(Bp4Me) and Ce(Tp4Me)3, respectively, in agreement with reported values for Ce(III) complexes43. In addition, the photoluminescence quantum yields (PLQYs, ΦPL) of the three complexes were measured as 97%, 98% and 97%, respectively. To further evaluate the photophysical parameters of these Ce(III) complexes, the radiative rate constant (kr) and non-radiative rate constant (knr) were calculated with the equation kr = ΦPL/τ and knr = 1/τ – kr. As shown in Table 2, the values of kr substantially exceed knr, indicating the Ce(III) centers are effectively shielded by the surrounding ligands and the non-radiative decay pathways are suppressed efficiently.

a Emission spectra of Ce(Tp4Me)(Bp4Me)2 at RT and 77 K with different excitation wavelengths. b Emission spectra of Ce(Tp4Me)2(Bp4Me) at RT and 77 K with different excitation wavelengths. c Emission spectra of Ce(Tp4Me)3 at RT and 77 K with different excitation wavelengths. d Temperature-dependent emission spectra of Ce(Tp4Me)3, the excitation wavelength is 340 nm. e Gaussian-peak fitting of the emission spectrum of Ce(Tp4Me)3 at 180 K. f Transient photoluminescence decays of Ce(Tp4Me)3. Emissions at 386 and 420 nm were measured with a 340 EPL source, and that at 438 nm with a 375 EPL source
At 77 K, Ce(Tp4Me)(Bp4Me)2 and Ce(Tp4Me)2(Bp4Me) show similar but more structured PL spectra compared to those at RT. The emission spectra of the two complexes split into two peaks located at 442 nm and 483 nm, 444 nm and 488 nm, respectively (Fig. 4a, b). The energy differences between these two peaks are approximately 2000 cm−1 (Figure. S7), further confirming that the emission originates from the 5d-4f transition. By varying the excitation wavelength from 300 nm to 380 nm, the PL spectra remain almost unchanged, indicating the emissions are excitation-independent (Figure. S8). In contrast, Ce(Tp4Me)₃ exhibits markedly different photoluminescent properties compared with Ce(Tp4Me)(Bp4Me)2 and Ce(Tp4Me)2(Bp4Me), as shown in Fig. 4c. Under 380 nm excitation, the emission spectrum is similar to that at RT, but with two obvious peaks at 438 nm and 480 nm. However, two new emission peaks emerge at 386 nm and 415 nm under 340 nm excitation, indicating the existence of a higher-lying 5d excited state. To gain insight into this unusual luminescence behavior, excitation spectra were recorded at the emission maxima of 438 nm and 386 nm (Fig. S9). In contrast to the excitation spectrum monitored at 386 nm, the excitation profile at 438 nm reveals the presence of an additional excitation band, indicating that the complex can emit from multiple excited states. As both the emissions are from the Ce(III) center, we tentatively ascribe the two emissions to two 5d excited states, denoted as low-energy D1L and high-energy D1H.
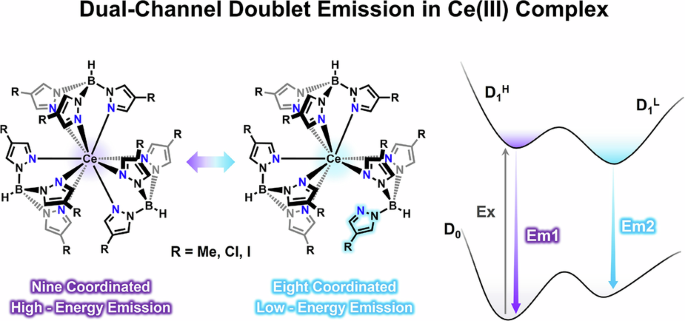
Considering the distinct PL behavior of Ce(Tp4Me)3 at RT and 77 K, temperature-dependent emission spectra were performed (Fig. 4d) under 340 nm excitation. Starting from 300 K, the complex only shows a D1L emission. With the temperature decreasing, the emission of D1H emerges at 200 K. The complex exhibits dual-channel doublet emission from both D1L and D1H to D0 in the temperature range of 200–160 K. Further decrease in temperature results in the extinction of D1L emission, and only the emission from the D1H state can be observed. To further visualize the dual-channel doublet emission at 200–160 K, the emission spectrum of Ce(Tp4Me)3 at 180 K was fitted into four Gaussian peaks, for example, with wavenumbers of 20791 cm−1(481 nm), 22715 cm−1 (440 nm), 24261 cm−1 (412 nm) and 26051 cm−1 (384 nm), respectively (Fig. 4e). The former two peaks originate from the D1L to the ground state D0 with an energy difference of 1924 cm−1, and the latter two peaks can be ascribed to the D1H to the ground state D0 with an energy difference of 1790 cm−1.
To further understand the excited state dynamics of D1L and D1H, the energy transfer rate (kET) and radiative transition rate (kr) were calculated by using transient photoluminescence decays (Fig. 4f). Ce(Tp4Me)3 displays mono-exponential decay with τ of 45 ns at 438 nm (D1L emission) and 33 ns at 386 nm (D1H emission) at 77 K. Considering the ΦPL of Ce(Tp4Me)3 is 97% (nearly 100%), thus the non-radiative transition rate is negligible. According to the equation that τ = 1/kr, the intrinsic radiative rates of D1L and D1H are approximately 2.2 × 10⁷ s−1 and 3.0 × 10⁷ s−1, respectively. At 180 K, the complex exhibits dual-channel doublet emission of D1L and D1H simultaneously with a bi-exponential decay of 43 ns and 21 ns at 420 nm, where 43 ns is assigned to the transition of D1L → D0, while 21 ns encompasses the process of both the radiative decay of D1H to D0 and energy transfer of D1H to D1L. Therefore, the kET (D1H → D1L) can be estimated as 1.7 × 10⁷ s−1 according to τ = 1/(kr + kET), which is slower than the radiative rate of D1H → D0 (3.0 × 10⁷ s−1). Therefore, under high-energy excitation, Ce(Tp4Me)3 exhibits both the low-energy emission of D1L → D0, the high-energy emission of D1H → D0, and energy transfer from D1H → D1L.
In addition, the photophysical properties of all five complexes in THF at RT and in 2-Methyltetrahydrofuran (2-MeTHF) at 77 K are closely similar to those observed in DCM, consistent with the Ce(III)-centered 5d-4f emission, which is only weakly affected by solvent polarity. The corresponding photophysical data are provided in Figs. S10–S12 and Tables S3, S4.
Subsequently, the photophysical properties of Ce(Tp4Me)(Bp4Me)2, Ce(Tp4Me)2(Bp4Me) and Ce(Tp4Me)3 were investigated in solid-powder state. As shown in Fig. 5a, b, Ce(Tp4Me)(Bp4Me)2 and Ce(Tp4Me)2(Bp4Me) exhibit blue emissions at RT, with FWHM values of 81 nm and 83 nm, respectively. At 77 K, their PL spectra further split into two distinct peaks, which is a result of the ground 4f state of Ce(III) being divided into two sublevels. By using different excitation wavelengths ranging from 300 nm to 380 nm at 77 K (Fig. 5d, e), the emission spectra remain almost unchanged, indicating that the emission originates exclusively from the lowest doublet excited state, i.e., single-channel doublet emission similar to typically reported Ce(III) complexes. In contrast, Ce(Tp4Me)3 exhibits distinct photoluminescent properties, as shown in Fig. 5c. The complex displays three emission peaks at around 385 nm, 420 nm, and 465 nm, with a FWHM of 90 nm, differing from its spectrum in DCM at RT. At 77 K, a more well-defined spectrum with three distinct peaks at 384 nm, 414 nm, and 477 nm was observed. By varying the excitation wavelength from 300 nm to 380 nm in 20 nm steps (Fig. S13), the emission maxima shifted obviously (Fig. 5f). These results demonstrate that Ce(Tp4Me)₃ has multiple emissive 5d excited states and exhibits dual-channel doublet emission at both RT and 77 K in solid-powder state. Then, excited-state lifetimes of the three complexes were measured at RT. Ce(Tp4Me)(Bp4Me)2 and Ce(Tp4Me)2(Bp4Me) exhibit mono-exponential lifetimes of 43 ns and 49 ns, respectively (Fig. S14). While Ce(Tp4Me)3 exhibits dual-channel doublet emission (D1L and D1H), leading to wavelength-dependent average excited-state lifetimes. The lifetimes increase from 31 ns at 385 nm to 38 ns at 420 nm and 44 ns at 465 nm (Fig. S15a), indicating that the progressive lengthening with red-shifted detection wavelengths reflects a longer excited-state lifetime for the D1L excited state compared to the D1H excited-state. All three complexes exhibit ΦPL of ~100% in the solid-powder state, as a class of highly efficient blue emissive Ce(III) complexes.

a Emission spectra of Ce(Tp4Me)(Bp4Me)2. b Emission spectra of Ce(Tp4Me)2(Bp4Me). c Emission spectra of Ce(Tp4Me)3. d Excitation-emission mapping of Ce(Tp4Me)(Bp4Me)2 at 77 K. e Excitation-emission mapping of Ce(Tp4Me)2(Bp4Me) at 77 K. f Excitation-emission mapping of Ce(Tp4Me)3 at 77 K
Interestingly, when keeping the coordination environment of Ce(III) ion unchanged, while replacing the 4-position methyl with Cl or I atoms, the resulted Ce(III) complexes Ce(Tp4R)3 (R = Cl, I) showed similar photophysical properties to Ce(Tp4Me)3 in solid-powder state both at RT and 77 K (Fig. 6, Table 3). For example, all three complexes display dual-channel doublet emission under 340 nm excitation and show only low-energy emission at 380 nm excitation at RT (Fig. 6a–c). At 77 K, all three complexes exhibit a more structured spectrum which can be split into four Gaussian peaks (Fig. 6d–f), corresponding to emissions from D1L and D1H. And all three complexes show excitation-dependent emission spectra (Fig. 6g–i) and wavelength-dependent excited-state lifetimes (Fig. S15). These results indicate that the dual-channel doublet emission in Ce(Tp4R)3 may arise from a nine-coordinated environment, as compared to Ce(Tp4Me)(Bp4Me)2 and Ce(Tp4Me)2(Bp4Me). The reproducible observation of dual-channel doublet emission in both purified solid-powder state and solution further indicates that this behavior is intrinsic to the Ce(III) complexes, rather than arising from sample purity. All five Ce(III) complexes show good thermal- (Fig. S16,S17), photo- (Fig. S18a), and air-stability (Fig. S18b), supporting their potential for practical applications.

a–c Emission spectra of Ce(Tp4Me)3, Ce(Tp4Cl)3, Ce(Tp4I)3 at RT, respectively. d–f Gaussian-peak fitting of Ce(Tp4Me)3, Ce(Tp4Cl)3, Ce(Tp4I)3 at 77 K, respectively. g–i Excitation-dependent emission spectra of Ce(Tp4Me)3, Ce(Tp4Cl)3, Ce(Tp4I)3 at 77 K, respectively
Computational investigations
To ascertain the origin of the dual-channel doublet emission in nine-coordinated Ce(Tp4R)3 (R = Me, Cl, I), the complexes Ce(Tp4Me)(Bp4Me)2, Ce(Tp4Me)2(Bp4Me), and Ce(Tp4Me)3 were selected as representatives for DFT and TD-DFT calculations. Detailed calculation methods were provided in the Materials and Methods.
The geometry optimization structures for the ground state (D0) and the first excited doublet state (D1) are shown in Fig. S19, and the optimized coordination bonds of the three Ce(III) complexes are listed in Table S5. Compared with the Ce-N bond lengths in the ground state, all Ce-N bond lengths in the excited-state have been shortened for Ce(Tp4Me)(Bp4Me)2 and Ce(Tp4Me)2(Bp4Me), suggesting that bonding interactions between the outer 5d orbital and the N atoms are stronger than those involving the inner 4f orbital. However, for Ce(Tp4Me)3, eight Ce-N bonds become shorter while one Ce-N bond shows a pronounced elongation in the excited state. This behavior may arise from excited-state structural relaxation, where the steric crowding in the nine-coordinate environment favors the formation of an eight-coordinate excited-state structure. Considering that one Ce-N bond elongates in the excited-state, the pyrazolyl fragment may rotate to a metastable conformation. To examine this possibility, the corresponding structure was constructed and subjected to geometry optimization (Fig. S20), and the optimized Ce-N bond lengths are summarized in Table S6. At the same computational level, the ground-state conformation with eight-coordination is 0.19 eV higher in energy than the nine-coordinated structure, suggesting the potential for a thermally activated conformational rearrangement55.
To further investigate the excited-state properties of these Ce(III) complexes, their emission spectra were calculated. Although the calculated emission maxima were underestimated by 0.35–0.40 eV relative to the experimental values, the overall spectral trends remained consistent, allowing for meaningful qualitative discussion. As illustrated in Fig. 7a, b, both Ce(Tp4Me)(Bp4Me)2 and Ce(Tp4Me)2(Bp4Me) exhibit single-channel doublet emission originating from the 5dxz/5dyz to 4fxyz transition with calculated emission wavelength at 509 nm (Exp: 437 nm) and 510 nm (Exp: 439 nm), respectively. In contrast, as shown in Fig. 7c, Ce(Tp4Me)3 displays dual-channel doublet emission due to the multiple excited states: a higher-energy emission (D1H) corresponding to the 5dxz/5dyz to 4fxyz transition, with a calculated emission at 441 nm (Exp: 384 nm), and a lower-energy emission (D1L) involving the same 5dxz/5dyz to 4fxyz transition but located at 500 nm (Exp: 439 nm). The calculated energy gap of 0.33 eV is in close agreement with the experimental values (~0.40 eV), further supporting the hypothesis for the existence of multiple radiative 5d excited states.

a The NTO analysis of Ce(Tp4Me)(Bp4Me)2 (top) and comparison between calculated and experimental emission spectra at 77 K in solid-powder state (bottom). b The NTO analysis of Ce(Tp4Me)2(Bp4Me) (top) and comparison between calculated and experimental emission spectra at 77 K in solid-powder state (bottom). c The NTO analysis of Ce(Tp4Me)3 with both nine-coordinated and eight-coordinated geometries (top) and comparison between calculated and experimental emission spectra at 77 K in solid-powder state (bottom). The predicted spectra were rendered as Gaussian line shapes. Oscillator strengths for the electronic transitions are shown as blue or purple vertical lines. Calculated NTOs in the gas phase with an iso-surface value of ±0.05