Most recent deforestation has been in the tropics; what are forests being cut down for?
Over the last two decades, the world has cut down forests at a rate of roughly one Costa Rica per year.1
The largest driver of deforestation has been the expansion of agriculture. This has been true for millennia, and it remains the case today.
But which products, in particular, have been responsible?
A recent study, published in Nature Food by Chandrakant Singh and Martin Persson, answered this question.2
In the chart below, you can see how much deforestation has been caused by different agricultural commodities. This is shown as the annual average between 2001 and 2023.
Beef was, by far, the largest driver, accounting for 41% of the total. Cattle need a lot of land for grazing, which means that the growing global demand for beef has led to the expansion of pasture. Beef alone has led to the destruction of more than two UK-sized areas of forest this century.
The second-largest driver was oilseeds. This category is dominated by deforestation for soy and palm oil; a lot of forest was lost to these plantations, especially in the first decade (as we’ll see later, these rates have fallen over the past ten years).
The other large drivers — accounting for 12% each — were forest plantations and cereal production.
Understanding what has driven deforestation is important, but so is understanding where the forests were lost.
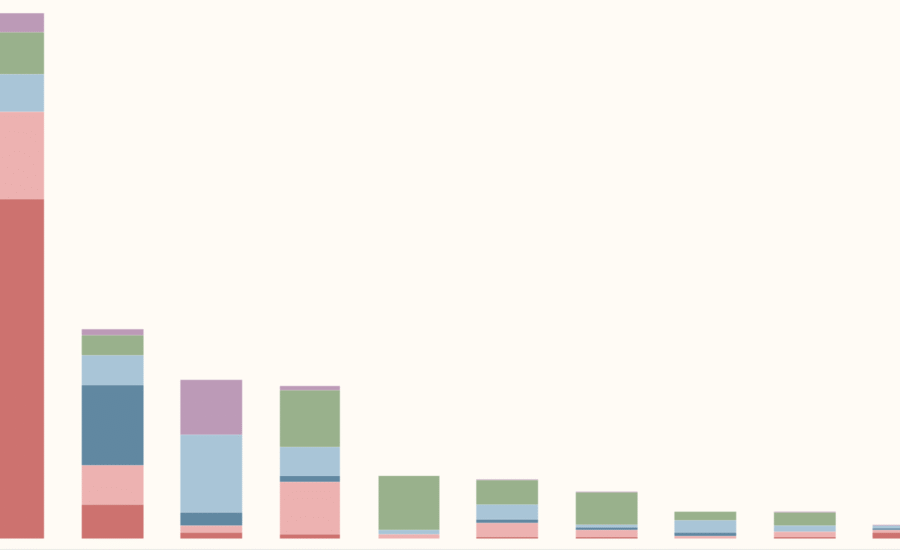
Let’s then take the chart above, but break each bar into the respective regions where it happened. Looking at the chart below, we see that these losses are extremely geographically concentrated for many products.
More than half of deforestation for beef production occurred in Brazil. In fact, one-quarter of all deforestation this century was driven by Brazilian beef production alone. Most other cattle pasture expansion happened in Brazil’s neighbors in Latin America. So, clearance for beef is not only the world’s largest driver of deforestation; it has also been centered on some of the most biodiverse ecosystems on the planet: the Amazon rainforest and the Cerrado savanna.
Beef alone has led to the destruction of more than two UK-sized areas of forest this century.
Most deforestation for oilseeds — the second-largest driver — has been for palm oil and soy. Almost all of the world’s demand for palm oil has been met by just two countries — Indonesia and Malaysia — and this shows in the deforestation data. 6% of global deforestation has been caused by Indonesian palm oil production.
Forest plantations have been a large driver in parts of Asia and North America, particularly in the United States and China.
Finally, you can see that across most other products, it’s Africa — shown in green — where the most forest has been lost. This is true for staple crops, such as cereals and roots and tubers, as well as for cash crops, such as fruits, nuts, coffee, and cocoa beans. You can also see this clearly when looking at the continent’s annual data.
As I’ve written previously, countries across sub-Saharan Africa achieve very low crop yields compared to the rest of the world. As a consequence, most of the growth in food production has come from using more land, rather than using land more productively. This has come at the cost of forests. Improvements in agricultural productivity are not just essential for food security and poverty reduction, but also for preserving natural habitats.
The scale of deforestation, even today, is hard for me to wrap my head around. But a closer look at the data also reveals that the world can do something about it, and for some products, has already done so. Palm oil is a clear example: while large amounts of forest were being cut down for oil palm plantations in the 2000s and early 2010s, rates have fallen substantially over the last decade.
Over the last two decades, the world has cut down forests at a rate of roughly one Costa Rica per year.
There are several reasons for this. One has been the growth in corporate commitments from food companies: many of the largest, including Unilever and Nestlé, adopted “No Deforestation, No Peat, No Exploitation” policies, committing not to buy palm oil from producers who have cut down forests for new plantations. Certification schemes, such as the Roundtable on Sustainable Palm Oil, expanded, giving companies the option to buy deforestation-free palm oil. Both of these changes were partly driven by successful campaigns from non-governmental organizations and public pressure.
The governments of Indonesia and Malaysia also took action to limit deforestation at home. In 2018, Indonesia launched a moratorium on the issuance of new oil palm plantation permits. Malaysia put a cap on the area that could be allocated to plantations, meaning any gains in palm oil production had to come from productivity improvements.
This combination of government action and corporate commitments, underpinned by public pressure, has contributed to a reduction in deforestation for palm oil. The world could achieve the same for other products, but this relies on our understanding of which products — and where — are driving deforestation in the first place. That’s why this data is so crucial.
Acknowledgments
Many thanks to Max Roser and Edouard Mathieu for their comments and suggestions on this article.
Cite this work
Our articles and data visualizations rely on work from many different people and organizations. When citing this article, please also cite the underlying data sources. This article can be cited as:
Hannah Ritchie (2026) - “What has driven deforestation in the 21st century?” Published online at OurWorldinData.org. Retrieved from: 'https://archive.ourworldindata.org/20260803-045936/what-has-driven-deforestation-in-the-21st-century.html' [Online Resource] (archived on August 3, 2026).BibTeX citation
@article{owid-what-has-driven-deforestation-in-the-21st-century,
    author = {Hannah Ritchie},
    title = {What has driven deforestation in the 21st century?},
    journal = {Our World in Data},
    year = {2026},
    note = {https://archive.ourworldindata.org/20260803-045936/what-has-driven-deforestation-in-the-21st-century.html}
}
Reuse this work freely
All visualizations, data, and articles produced by Our World in Data are completely open access under the Creative Commons BY license. You have the permission to use, distribute, and reproduce these in any medium, provided the source and authors are credited.
The data produced by third parties and made available by Our World in Data is subject to the license terms from the original third-party authors. We will always indicate the original source of the data in our documentation, so you should always check the license of any such third-party data before use and redistribution.
All of our charts can be embedded in any site.